
Right-click on a page → “Inspect.” Have you ever quietly closed the cluttered screen that popped up? That’s the developer tools — web-building’s strongest sidekick, where you can peek at a web page’s contents and tweak them on the spot. There are tons of features, but you only need to learn 3 first.
Three ways to open it
- Right-click → “Inspect” on the page (do it over the spot you want to examine, and it opens with that spot selected)
- The F12 key
- Mac: ⌘+option+I / Windows: Ctrl+Shift+I
To close it, press the ”×” at the top right or the same key once more.
No. 1: The Elements panel — peek at HTML and CSS
What you see right after opening is the Elements panel. The contents of the HTML of the page you’re viewing appear like a tree, and clicking a line makes the corresponding spot on the page light up.
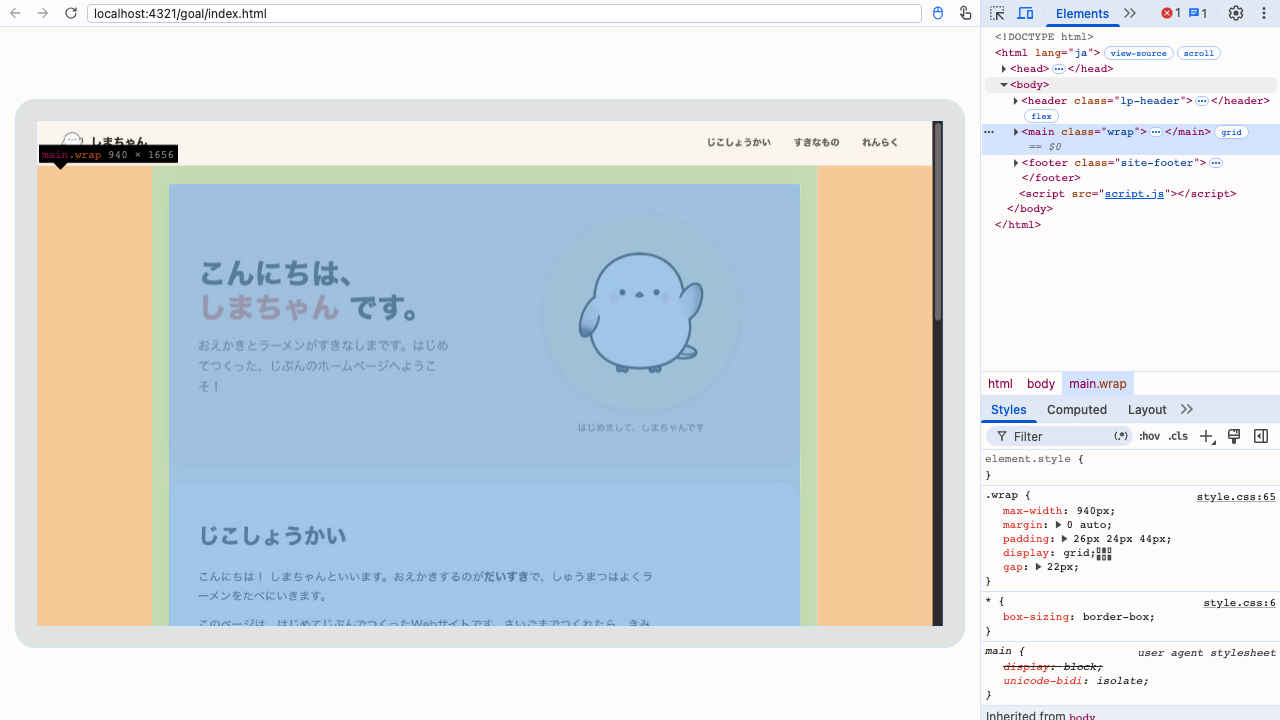
The Styles in the lower half lists all the CSS taking effect on the selected spot. Here’s the amazing part —
- Click a number and rewrite it, and the page changes on the spot (trial and error with margins and font sizes takes an instant)
- Uncheck it to temporarily turn that setting off (you learn “what job does this CSS do?”)
- A setting with a strikethrough is a sign that it’s being overridden by other CSS and isn’t taking effect
- Click the square color swatch next to a color setting, and you can switch the notation between
#rrggbb,rgb(), andhsl(), or change the color itself with the color picker
No matter how much you tinker, reloading restores it. It’s a sandbox with no fear of breaking anything, so tinker away. Once you find a number you like, copy it into your own style.css and it’s done.
No. 2: The Console panel — read errors and messages
The Console is the page’s “notification window.” JavaScript errors, messages you wrote with console.log, files that failed to load — they all arrive here.
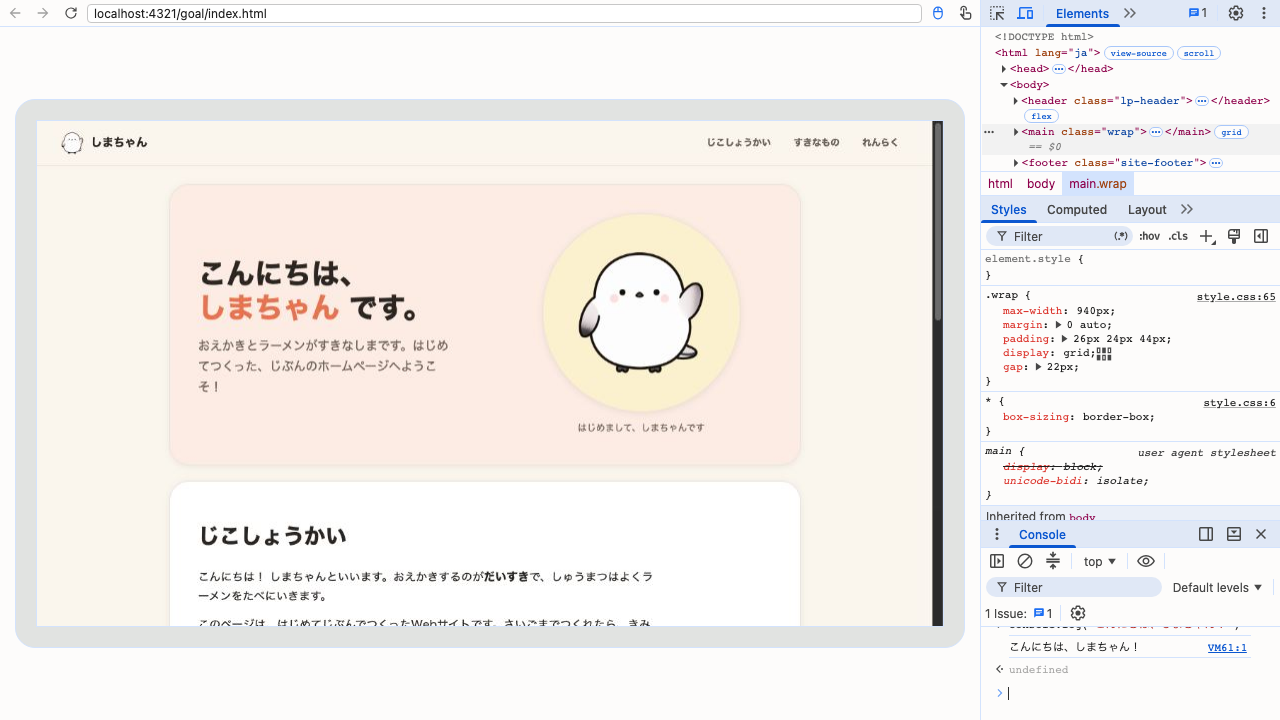
“The button doesn’t work when I press it,” “the image won’t show up” — this is the first place to look when you’re stuck. If red text appears, that’s a hint to the cause.
TipsDon't panic when an error appearsHow to read red errors is covered in detail in this articleJavaScriptCheck things with the consoleHow to output messages to the Console from your own program is over hereNo. 3: The Device Toolbar — check how it looks on a smartphone
Press the overlapping smartphone-and-tablet icon at the top left (Mac: ⌘+shift+M), and the page displays at smartphone screen width. You can choose a model or freely drag the width, so checking “does it look broken on a phone?” can be done without pulling out your phone.
CSSMake it look good on phones too: media queriesHow to switch the look by screen width (media queries) is over hereOne more worth knowing: the Network panel
“The image won’t display” and “the CSS won’t apply”—the two most common beginner stumbles—are usually caused by the file never arriving in the first place. The Network panel settles that question.
- Open the Network tab
- Reload the page while it’s open (traffic from before you opened it isn’t recorded, so this order matters)
- Every file that loaded appears in a list
The only column you need is Status.
| Status | Meaning | What to do |
|---|---|---|
| 200 | Arrived fine | The file is there; the cause is in how the CSS is written |
| 304 | Unchanged, so the previous copy was used | Normal. The cache is working |
| 404 | Not found | A wrong path or file name. Check the spelling and the letter case |
| 403 | Not allowed | A permissions setting on the server. Check your host’s settings |
| (red / failed) | The request itself failed | Check for spaces or unusual characters in the file name |
If style.css is a 404, no amount of reviewing your CSS will fix it. Confirm it arrived first—that’s the trick to not going the long way round.
Look up the panel by symptom
A table for when you’re not sure which panel to open.
| Symptom | Panel | What to look at |
|---|---|---|
| CSS won’t apply | Elements → Styles | Whether it’s struck through, or listed at all |
| Not sure which CSS is winning | Elements → Computed | Only the values that finally applied |
| The button does nothing | Console | The first line of the red error |
| The image won’t show | Network | Whether Status is 404 |
| Can’t tell where the spacing comes from | The box diagram below Styles | The measured margin, border and padding |
| It breaks on a phone | Device Toolbar | Drag the width to find where it breaks |
| The font won’t change | Elements → Computed | The name actually used for font-family |
Shortcuts worth knowing
| Action | Mac | Windows |
|---|---|---|
| Open / close DevTools | ⌘ + ⌥ + I | F12 |
| Element picker | ⌘ + ⇧ + C | Ctrl + Shift + C |
| Overlay the Console | Esc | Esc |
| Device Toolbar | ⌘ + ⇧ + M | Ctrl + Shift + M |
| Reload ignoring the cache | ⌘ + ⇧ + R | Ctrl + Shift + R |
The fastest way to improve
It’s to break apart a site you like with “Inspect.” Right-click → Inspect on a button you thought was pretty. What color? How many px of margin? The corner radius? — a pro’s technique is all right there in numbers. Look, tinker, imitate. Developer tools are a “textbook of the web” you can read for free, infinitely.
TipsChrome extensions that make research fasterOnce you’re used to developer tools, extensions that let you look up colors and fonts in one shot are worth a try tooSummary
- Open it with right-click → “Inspect.” A safe sandbox that reloading restores no matter how you tinker
- Peek at HTML and CSS in Elements, and rewrite the numbers in Styles on the spot for trial and error
- When stuck, the Console. A red error is a hint to the cause
- When images or CSS don’t show up, check Status in Network. A 404 means a wrong path
- When your fix changes nothing, reload ignoring the cache with
⌘/Ctrl + ⇧ + R
From the day you stop being afraid of “Inspect,” your progress at web building accelerates all at once.